

Airbnb vs. Long-Term Rental: How to Compare the Two on the Same Property
The Airbnb-versus-long-term-lease debate is almost always argued on one number: monthly income. But a rental property pays you twice — while you hold it, and when you sell it. Most short-term rental calculators model the first payment in detail and go completely silent on the second. This guide covers how to compare both strategies on the same property, including the part everyone skips.
The trade, in one paragraph
A long-term rental trades upside for stability: one tenant, one monthly check, modest expenses, a vacancy hit when leases turn over. A short-term rental flips that: nightly pricing can gross well above a lease in the right market, but occupancy swings with seasons, and cleaning, platform fees, utilities, supplies, and management take a far bigger cut of every dollar. Add regulatory risk — many cities cap, license, or ban short-term stays — and the “which earns more” question stops having a one-word answer. It has a property-by-property answer.
Compare them on the same property, honestly
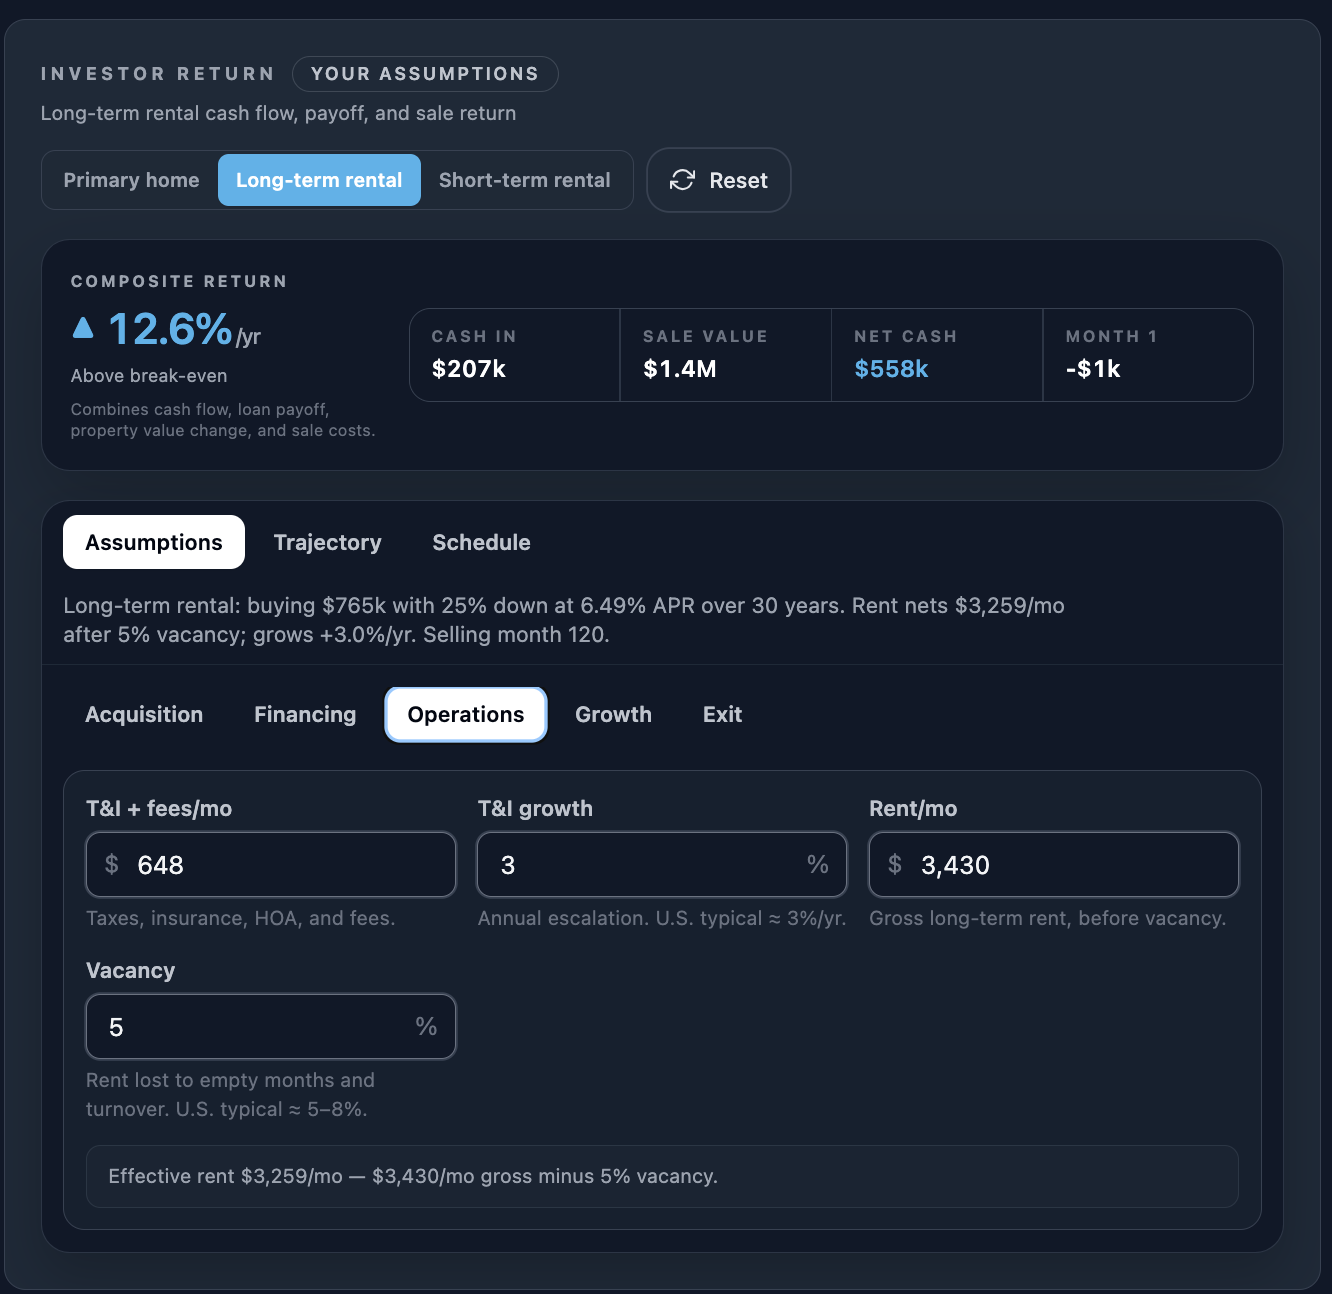
The long-term math
Start from market rent, then subtract a vacancy allowance — empty months and turnover typically cost around 5–8% of gross. What remains is the effective rent that actually covers your mortgage, taxes, and insurance.
The short-term math
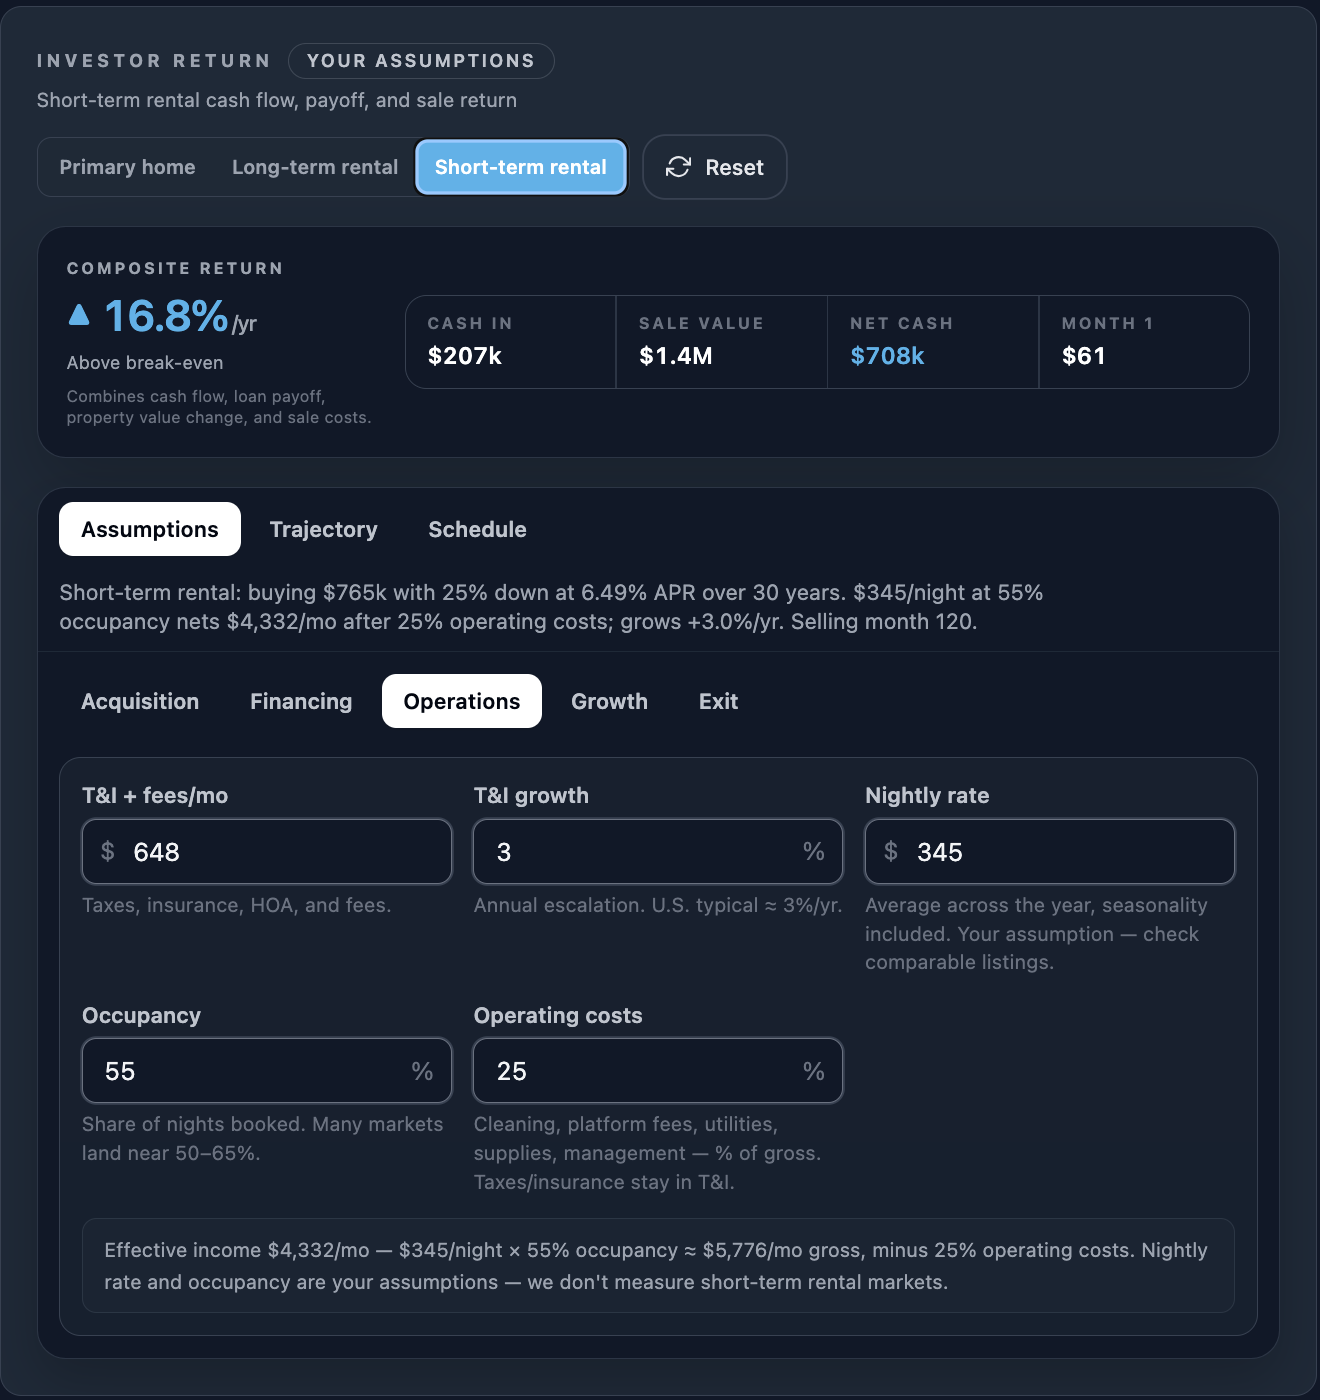
Start from an average nightly rate — averaged across the whole year, slow season included — multiplied by the share of nights you expect to book. Many markets land near 50–65% occupancy. Then subtract short-term operating costs: cleaning and turnover, platform fees, utilities, supplies, and management, which together routinely absorb a quarter or more of gross revenue.
Assumptions, not forecasts
The input every rental calculator skips: appreciation
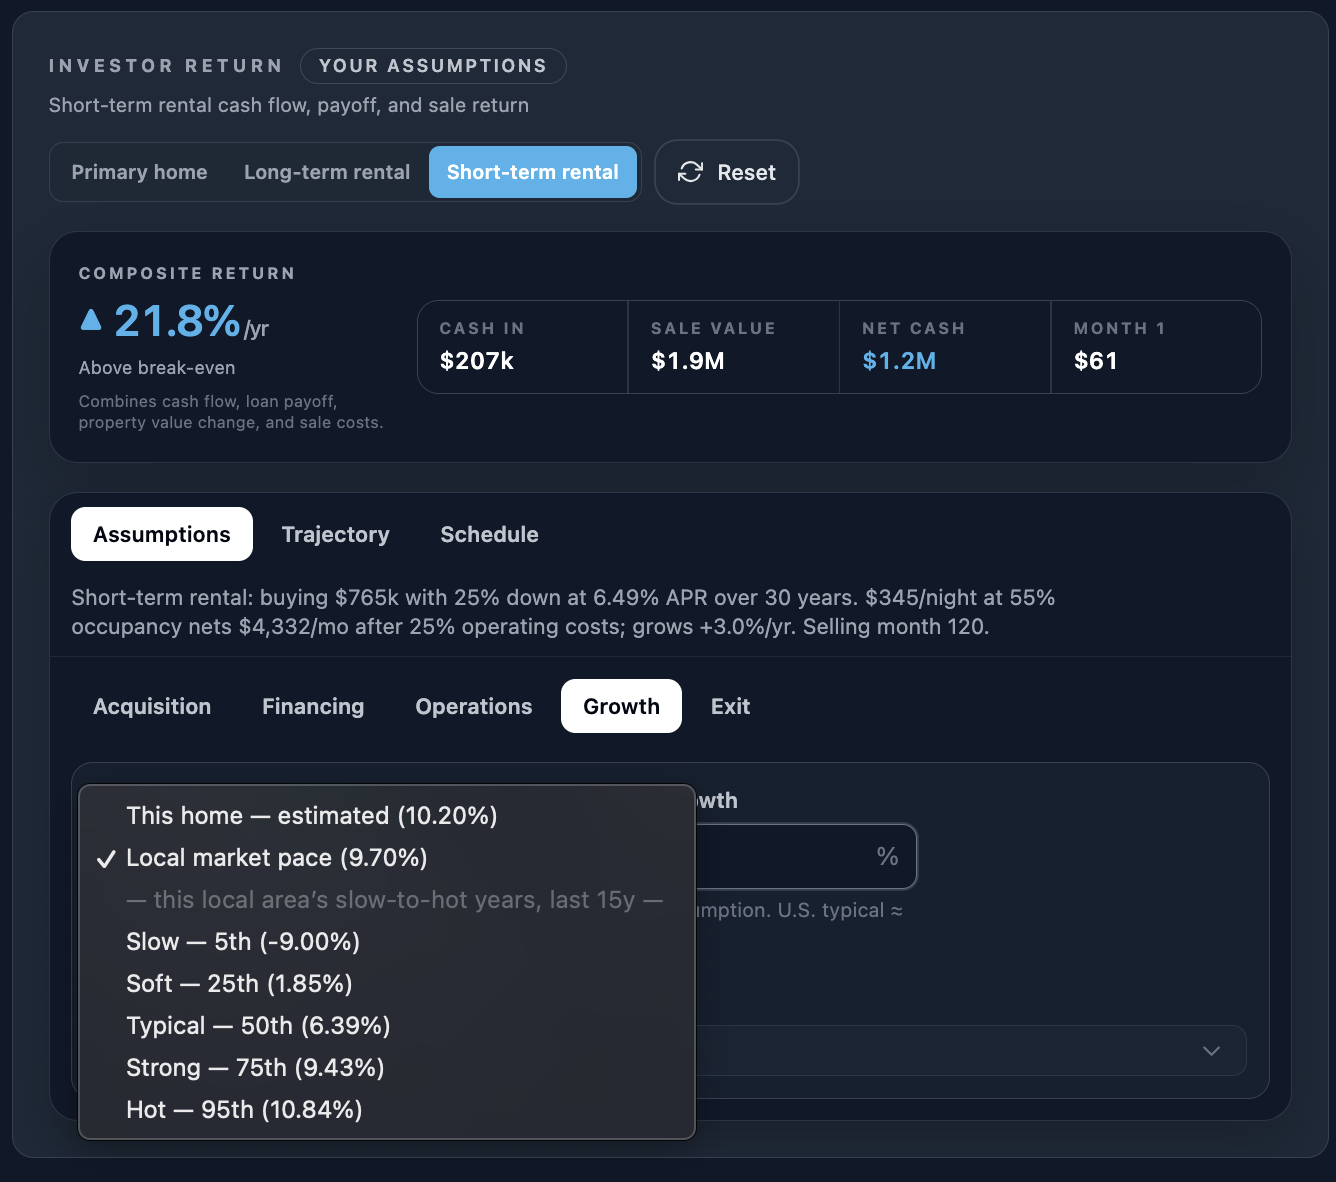
Here is what the income debate misses: whichever way you rent it, the property exits through the same door — a sale, years from now, at whatever the home is worth then. On a long hold, that exit often decides more of the total return than the monthly income difference between the two strategies. Yet the appreciation line in most rental analyses is a single national average typed in on faith.
Appreciation is intensely local. Homes in the same ZIP code appreciate at meaningfully different rates, and a nightly-rate calculator has nothing to say about which side of that divide your property sits on. This is the layer Good Investment exists for: it scores a home against its own local market, translates that score into a measured market edge, and pairs it with local home-price history — so the growth assumption under your rental scenario is grounded in how homes like this one have actually performed, with confidence flags where the data is thin.
How Good Investment helps
When each strategy tends to win
- Long-term wins when you value predictability, the market has thin tourist demand, local rules restrict short stays, or you don't want an operating business on top of an investment.
- Short-term wins when nightly demand is deep and year-round, you can run tight operations (or pay someone who can), and the regulatory picture is stable enough to underwrite.
- The property itself decides more than the strategy on long holds: a home positioned to out-appreciate its market builds wealth under either income model, and a poorly positioned one can erase a nightly-rate premium at sale.
The bottom line
Model both strategies with honest costs on the same home — the switch takes one click. Then give the exit the same rigor you gave the income: appreciation is the input that separates two identical-looking rentals, and it is the one a booking calculator will never give you. Start with appreciation vs. cash flow or run an address through the property appreciation analysis.
Frequently asked questions
Is an Airbnb more profitable than a long-term rental?
Sometimes on gross income, less often on net. A short-term rental can gross well above a long-term lease, but cleaning and turnover, platform fees, utilities, supplies, management, and empty nights claim a much larger share of that gross — and local rules can cap or close the strategy entirely. The honest answer comes from modeling both on the same property with your own occupancy and cost assumptions, not from a rule of thumb.
How do I estimate short-term rental income?
Multiply an average nightly rate by the share of nights you expect to book, then subtract short-term operating costs (cleaning, platform fees, utilities, supplies, management). Average the nightly rate across the whole year, including the slow season, and treat every input as your assumption to stress-test — not a measurement. If the deal only works at peak-season occupancy, it does not work.
Does the rental strategy change how much a home appreciates?
Mostly no. Appreciation potential is a property-and-market question — the home’s position, attributes, and local demand — while the rental strategy mainly changes the income stream and holding costs. Both strategies exit through the same door: a sale at whatever the home is then worth. That is why the appreciation side deserves its own analysis, whichever way you rent.
What extra costs does a short-term rental have?
Cleaning and turnover, platform fees, utilities you now pay yourself, supplies and consumables, furnishing and refresh cycles, higher-touch management (often 20–30% of gross if outsourced), and in many cities permits, lodging taxes, or licensing. Together these routinely absorb a quarter or more of gross revenue — which is why a short-term rental can out-gross a lease and still net less.
Run a real address
See how an individual home ranks for appreciation within its own market.
Try the analysis