

The same ranking engine, at portfolio scale.
Good Investment is the appreciation layer for residential real estate. The same within-market score, measured market edge, estimated appreciation pace, and confidence an individual buyer sees — delivered at portfolio scale as bulk scoring, portfolio analysis, or a continuous API.
We'll send a redacted portfolio PDF built on our sample-report pipeline, sized to the segment you're working in.See how the report is built →
One signal. From one home to many.
One property intelligence layer, from single address to portfolio decisions.
The scoring and market-edge engine that surfaces when an individual buyer types an address is the same engine that scores a 5,000-property portfolio. The signal does not bifurcate — what changes is the surface: a single-property hub for a consumer, bulk scoring or a continuous API for an institutional desk. One source of truth is the entire thesis.
What the read looks like
Two surfaces of the same signal.
The within-market score, measured market edge, and estimated appreciation pace live next to the per-property cash-flow read — so a credit, mortgage, or SFR desk can move from “does this row score?” to “does it cash flow?” without switching tools.
Summary
Key drivers, opportunities, and risks
Property appreciation intelligence
County basisUpper tier of comparable homes in Colorado Springs CO
Ahead of most comparable homes in the local market.
What the rank means in return terms
Measured performanceEstimated appreciation
Market view + measured edge
Measured market edge
+0.5%/yr
vs the average Colorado Springs CO home
Market view
9.7%/yr
Market edge
+0.5%/yr
Est. pace
10.2%/yr
In historical tests, homes ranked here performed close to their own market’s average pace. The score’s power is at the extremes — for a home in this range, the price you pay and the cash-flow story matter more than the rank. Local market pace is seeded from recent ZIP-level history.
Measured in historical tests; the edge varies with market conditions and by market. Model-generated estimate. Not investment advice.
Neighborhood risk profile
Measured historyCounty history basisVolatility (15y)
5.8pp
full history 6.9pp
Beta vs U.S. (15y)
0.89
full history 0.95
Max drawdown
−31.6%
worst year −21.0%
5y vs 15y pace
+3.1pp
8.8% vs 5.7%/yr
Measured from this area’s own history against a U.S. state-average index. Betas shift with regimes — read the 15-year and full-history figures together. The recent 5-year pace runs well ahead of the 15-year — recent-cycle heat, not a structural trend.
Price indexes smooth single-home volatility, individual home volatility will vary. Model-generated estimate. Not investment advice.
Score + appreciation values
“Does this row score?”
Within-market score, measured edge, estimated pace, confidence, and score basis — one read per row.
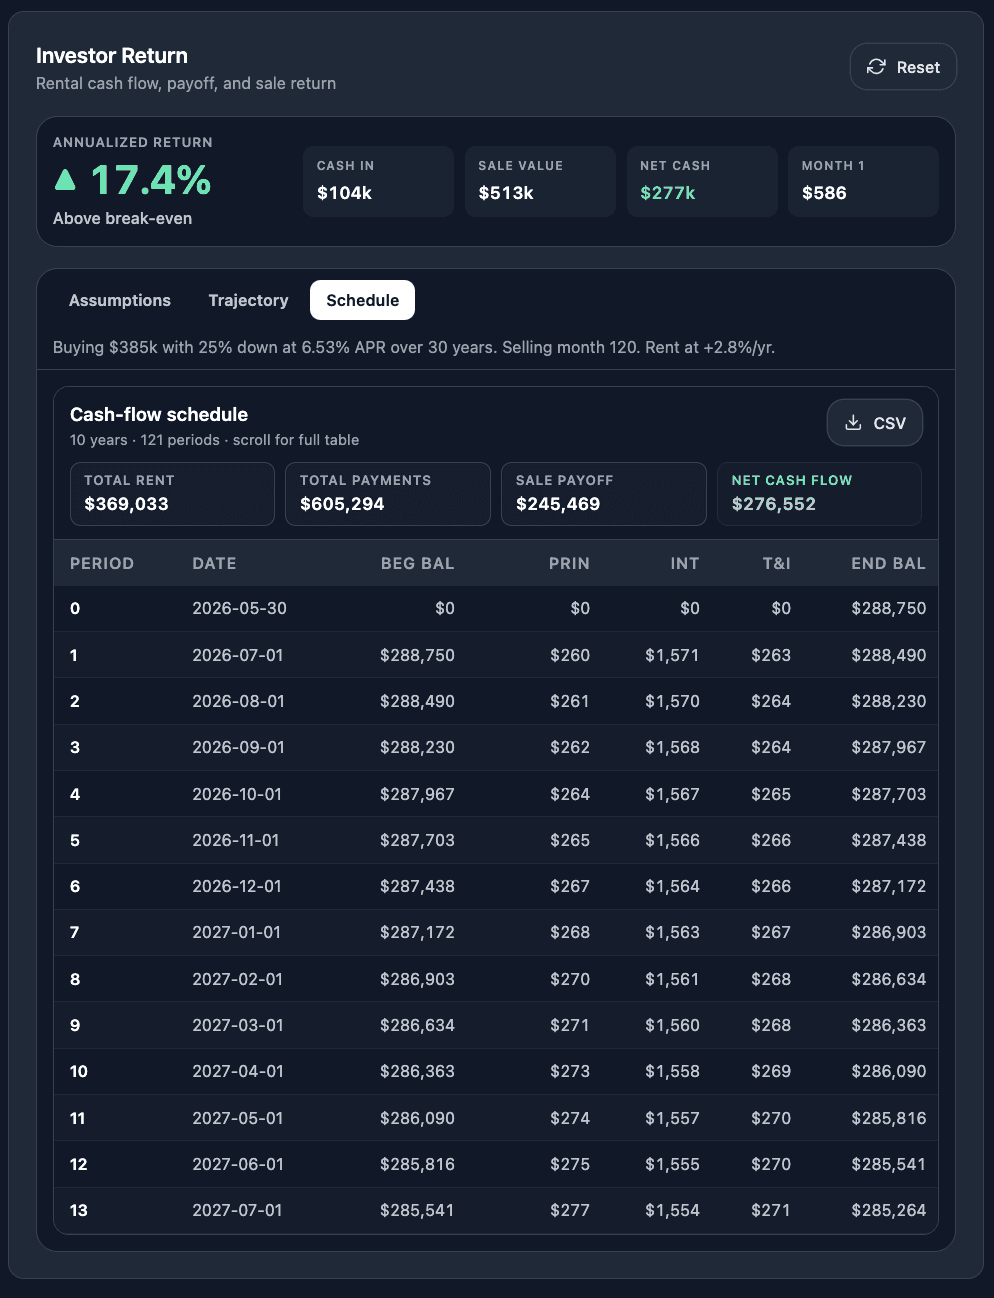
Per-property cash flow
“Does it cash flow?”
Annualized return, monthly cash, sale value, and a full month-by-month schedule — the per-row decision read mortgage and credit desks asked us to build.
Same engine. Bulk-scored for a tape, rendered per-row for review. See how the report is built →
Where the signal fits
Workflows we're designed for.
Three repeatable shapes of work that the score and market edge support.
Screen a watchlist
The workflow
A list of properties under review with no fast way to know where to focus diligence time.
How we fit
Score each property within its market, compare measured market edges and estimated paces, and route rows with drivers and confidence attached.
Manage held-asset exposure
The workflow
The risk in a book is rarely one bad property — it’s concentrated lower-confidence rows hiding inside the portfolio.
How we fit
See which markets and which holdings carry weaker appreciation signal and lower confidence, before they surface as a surprise in quarterly review.
Defend a decision
The workflow
A committee or counterparty needs to know why a property advances, needs review, or is removed from consideration.
How we fit
Every score ships with measured market edge, estimated appreciation pace, drivers, confidence, and neighborhood evidence for committee review.
Who we work with
Four families of institutional buyer.
Pricing scales with the engagement type. Tell us what you're sizing and we'll send a brief that matches.
Lenders
Origination screening & exit risk
For RTL, fix-and-flip, and non-QM desks deciding which collateral to underwrite — and where exit risk concentrates before it shows up in loss data.
RTL · Fix-and-flip · Non-QM
Whole-loan investors
Recovery & long-duration collateral
For RPL/SPL analysis, LGD stratification, and long-horizon collateral signal — including HECM/HMBS pool screening where proxies dominate today.
RPL/SPL · HECM/HMBS
SFR funds & operators
Acquisition screening at scale
For SFR aggregators and operators screening hundreds of acquisition candidates — within-market score, measured market edge, estimated pace, and confidence on every property.
SFR aggregators · Operators
REITs & portfolio teams
Portfolio + acquisition rail
For REIT and portfolio teams running held-asset review and acquisition screening on the same signal — one score, one market-edge framework, one source of truth.
REIT · Portfolio
Institutional API
Continuous scoring on a portfolio that changes daily. Layers on top of any engagement above — usually after the first real engagement, not before.
Customized portfolio views — enterprise
Enterprise engagements get a portfolio view shaped to the segment: pool stratification, concentration cuts, IC review queues, and custom thresholds layered on the same underlying signal.
Tell us what you're sizing.
Thirty seconds is enough — segment, rough size, and the workflow you're thinking about. We'll send a brief that matches and book a call.
Prefer email? Pick your segment — we'll triage faster