

HouseCanary vs Good Investment
Two real estate platforms — answering two different questions.
HouseCanary is an enterprise valuation and forecasting platform — built to estimate what a property is worth. Good Investment is the appreciation layer: it scores each home within its market and translates the score into a measured market edge and estimated appreciation pace, with confidence on every read.
Our question: how does this property score within its market, and what appreciation values does that score imply?
Enter any address above to see the within-market score, measured market edge, estimated pace, and confidence.
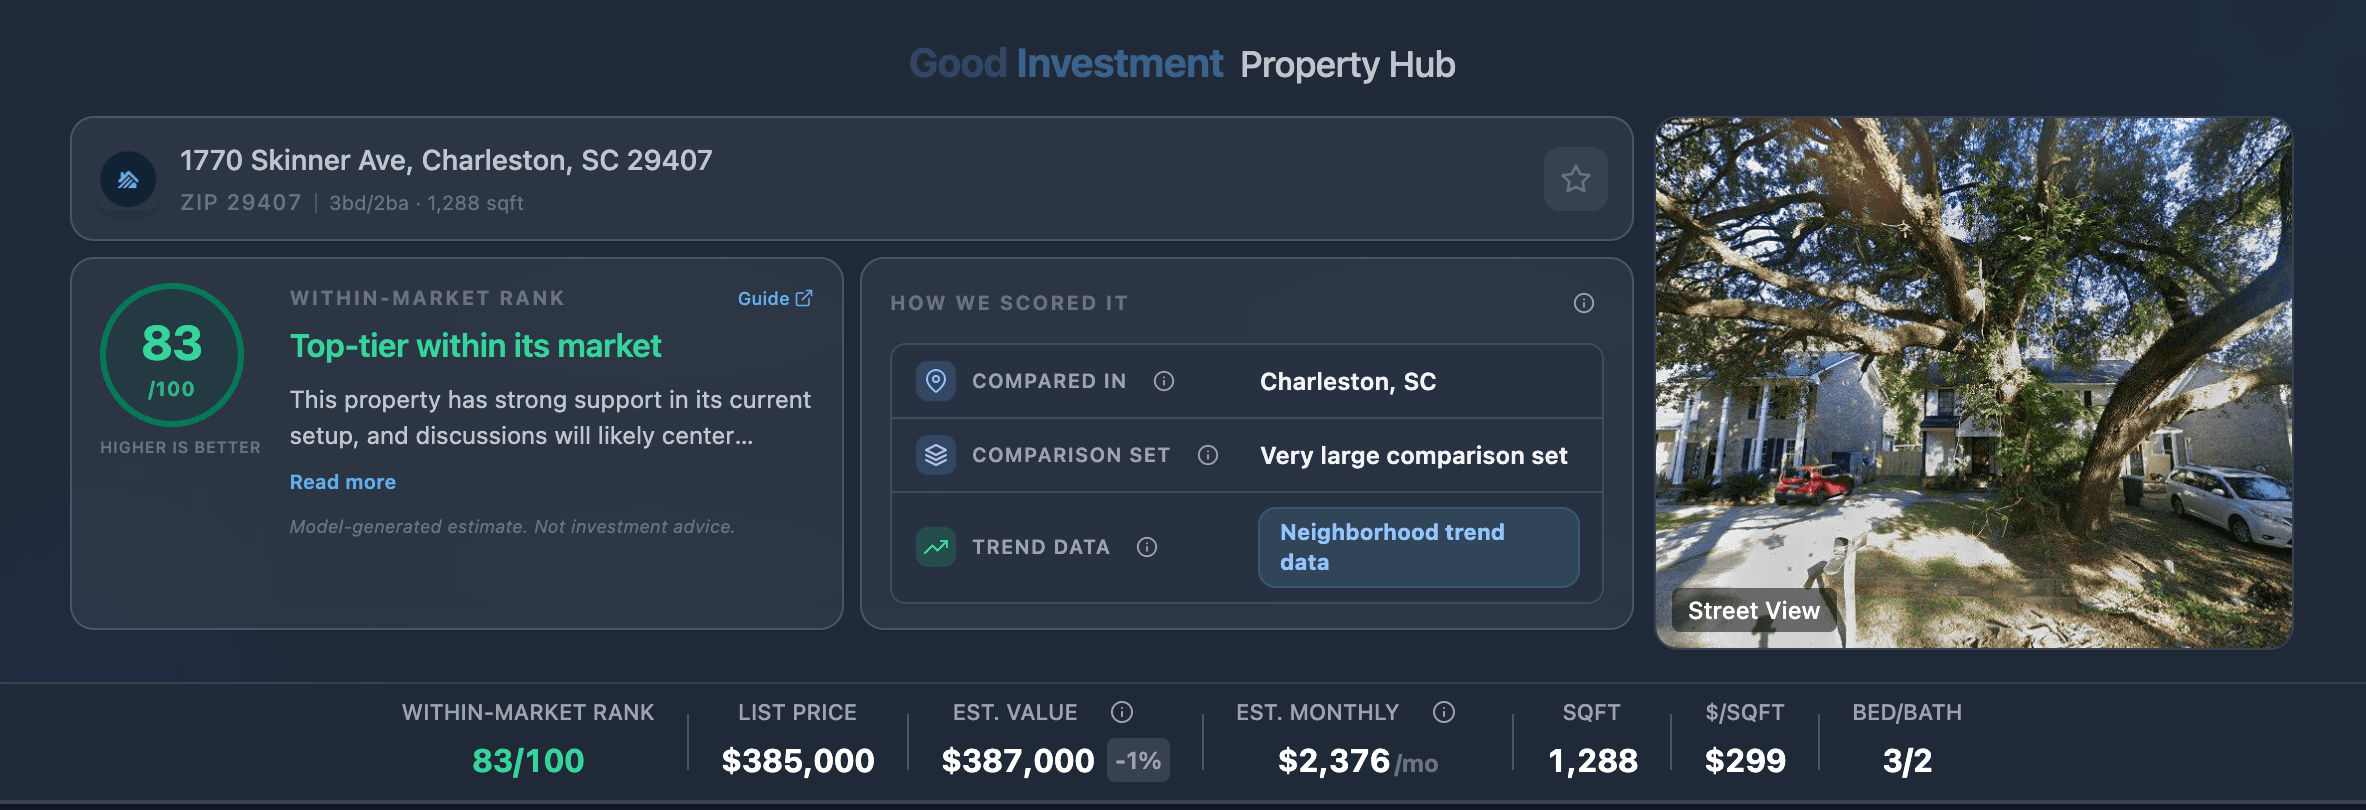
Within-market score, market edge, estimated pace, and score basis — one read. See how it's built →
HouseCanary
A serious enterprise valuation and forecasting platform — the kind institutions, lenders, and large operators reach for when they need deep AVM, price forecasts, and large-scale data access.
It's built for:
- •Enterprise valuation and AVM workflows
- •Price forecasts and market-level modeling
- •Large-scale data access and integrations
- •Institutional valuation infrastructure
Good Investment
A different question, not a smaller one. We score the property within its own market, translate the score into measured excess appreciation and an estimated pace, and ship confidence with every read. Same engine for one home or a portfolio.
It's built around:
- Within-market score plus measured market edge in points per year
- Estimated appreciation pace built on the adjustable market view
- Coverage-aware flags on every property — limited-comps, broader-basis, insufficient-data named, not hidden
- Neighborhood appreciation context below ZIP and metro averages
- One signal from a single home to a full portfolio — same engine, different surface
Feature Comparison
- Question answered
- What is this property worth?
- How does this property score, and what market edge does that imply?
- Core output
- Valuation and forecast models
- Within-market score + appreciation values + confidence
- Scale
- Property to portfolio — separate workflows
- Single home to portfolio — same engine, different surface
- Cross-market reads
- Absolute price forecasts and indices
- Within-market only — no cross-market leaderboards
- Coverage honesty
- Model-driven confidence intervals
- Coverage-aware: limited-comps and broader-basis flags named, not hidden
- How it ships
- Enterprise data and API contracts
- Single-property reports, portfolio PDFs, API — sample on request
- Time to first read
- Enterprise onboarding
- Address → score and market edge in seconds
- Ideal use case
- Institutional valuation infrastructure
- Appreciation source of truth — for one home or a full book
Valuation vs appreciation rank
Valuation answers:
“What might this property be worth?”
Appreciation rank answers:
“How does this property rank for appreciation in its own market — and how confident is that rank?”
Good Investment is built around the second question.
Instead of estimating today's price, we score appreciation position within a market and translate it into values. Every read carries:
- Within-market score plus measured market edge versus that home's market
- Coverage-aware confidence flag — the rank says what it was built on
- Neighborhood appreciation history below ZIP averages
- Plain-language drivers — what's helping the rank and what's hurting it
The same engine serves whoever is asking:
- A buyer or advisor sizing a single property
- An agent explaining the local read in plain language
- An investor screening a watchlist of candidates
- A mortgage, credit, SFR, or REIT desk running portfolio-scale review on the same signal — see institutional workflows
- Anyone who wants the rank to come with a confidence flag — not without one
Choose based on the decision you need to make
If you need an estimated value, use valuation infrastructure. If you need to understand a property's appreciation position — and the context and confidence behind it — use Good Investment.
Choose HouseCanary for valuation
HouseCanary is a fit when the primary output you need is an AVM, price forecast, or large-scale valuation data.
- •Estimate current property values at enterprise scale
- •Produce absolute price forecasts or cross-market indices
- •Have data teams and enterprise workflows ready to integrate valuation outputs
The question it answers: “What is this property worth?”
Choose Good Investment for the investment read
Good Investment turns property and market data into a decision-ready view of appreciation potential — not just another value estimate.
- See how a home ranks against relevant properties in its own market
- Translate that rank into measured market edge and an estimated appreciation pace
- Understand the local drivers and how much confidence to place in the result
- Get a usable read in seconds without an enterprise implementation
- Use the same signal for one home, a shortlist, or a full portfolio
The advantage: the score comes with the appreciation context needed to interpret and compare it.
Common questions
Is Good Investment an alternative to HouseCanary?
For appreciation analysis, yes; for valuation, no. HouseCanary is enterprise valuation infrastructure — AVMs, price forecasts, large-scale data. Good Investment answers a different question: how a specific home is positioned to appreciate within its own market, with a measured market edge and a confidence flag. Teams that need valuation keep a valuation platform; teams whose question is appreciation use Good Investment as the alternative — or run it alongside as the appreciation layer.
What is the difference between HouseCanary and Good Investment?
The question each one answers. HouseCanary estimates what a property is worth — valuation models, forecasts, and data infrastructure. Good Investment scores how a property is positioned to appreciate inside its own local market and translates that score into a measured market edge and an estimated appreciation pace, with coverage flags named rather than hidden.
Do I need an enterprise contract to use Good Investment?
No. Enter an address and the within-market score, market edge, estimated pace, and confidence flag come back in seconds; a free account covers individual use. Portfolio review and API access exist for institutional teams, but there is no enterprise onboarding required to get a first read.
Does Good Investment provide AVM valuations?
No. Good Investment is not an AVM and does not estimate what a home is worth today — it flags where a listing diverges from valuation context, and focuses its modeling on appreciation position within the local market. Pair it with your valuation source of choice; the two answer different questions.
HouseCanary is a registered trademark of its respective owner. This comparison is for informational purposes only and does not imply affiliation, endorsement, or partnership.