

How Good Investment works
From address to appreciation read.
Good Investment turns scattered property, market, and local history into a within-market score, a measured appreciation edge, and an estimated pace people can use in diligence.
The simple version
Comps answer one question: what did similar homes sell for? Good Investment answers the next two: how does this property rank inside its own market, and what has that rank meant for appreciation versus the market's average pace?
That read becomes the bridge between the consumer question and the professional workflow. Buyers see what matters. Agents can explain it. Investors and teams can turn it into diligence, pricing, review, or committee action.
What it is: a property-level appreciation screen that translates local rank into a measured market edge and an estimated pace, with driver explanations and confidence.
Summary
Key drivers, opportunities, and risks
Property appreciation intelligence
County basisUpper tier of comparable homes in Colorado Springs CO
Ahead of most comparable homes in the local market.
What the rank means in return terms
Measured performanceEstimated appreciation
Market view + measured edge
Measured market edge
+0.5%/yr
vs the average Colorado Springs CO home
Market view
9.7%/yr
Market edge
+0.5%/yr
Est. pace
10.2%/yr
In historical tests, homes ranked here performed close to their own market’s average pace. The score’s power is at the extremes — for a home in this range, the price you pay and the cash-flow story matter more than the rank. Local market pace is seeded from recent ZIP-level history.
Measured in historical tests; the edge varies with market conditions and by market. Model-generated estimate. Not investment advice.
Neighborhood risk profile
Measured historyCounty history basisVolatility (15y)
5.8pp
full history 6.9pp
Beta vs U.S. (15y)
0.89
full history 0.95
Max drawdown
−31.6%
worst year −21.0%
5y vs 15y pace
+3.1pp
8.8% vs 5.7%/yr
Measured from this area’s own history against a U.S. state-average index. Betas shift with regimes — read the 15-year and full-history figures together. The recent 5-year pace runs well ahead of the 15-year — recent-cycle heat, not a structural trend.
Price indexes smooth single-home volatility, individual home volatility will vary. Model-generated estimate. Not investment advice.
A live property in the hub: within-market rank, market edge, estimated pace, and score basis in one read.
Four pieces, one source of truth
Start with the property
Search an address or bring a tape.
Good Investment begins with the real asset: the home, its market, its comparable set, and the facts a buyer or team already cares about.
Rank it within its market
Trajectory, not just current price.
The model compares a property with homes in the market it actually competes in and scores its relative appreciation position.
Add local context and review routing
Neighborhood history plus data coverage.
The read includes local appreciation context and flags rows where comparable support, pricing, or data coverage deserves another look.
Share the decision read
A report built for clients, diligence, and committee.
The output is a plain-language report: rank, measured market edge, estimated appreciation pace, drivers, local context, and budget math.
From rank to appreciation value
The score becomes two numbers you can use.
Measured market edge
Each score maps to measured excess appreciation versus the home's own market — the market edge, in points per year. It comes from blind historical tests on homes the model had never seen; the measured results ship with every report.
Estimated appreciation pace
Add the measured edge to your adjustable market view to see an estimated appreciation pace. The report keeps the market view and the measured edge separate, so the basis of the estimate stays visible.
What happens under the hood
Market-relative ranking
The property is compared within its market, then the score is translated into excess appreciation versus that same market.
Neighborhood context
Historical local appreciation adds a read below broad ZIP and metro averages, where many decisions actually differ.
Coverage-aware routing
The product shows when comparable support is strong enough to move and when the row belongs in analyst or client review.
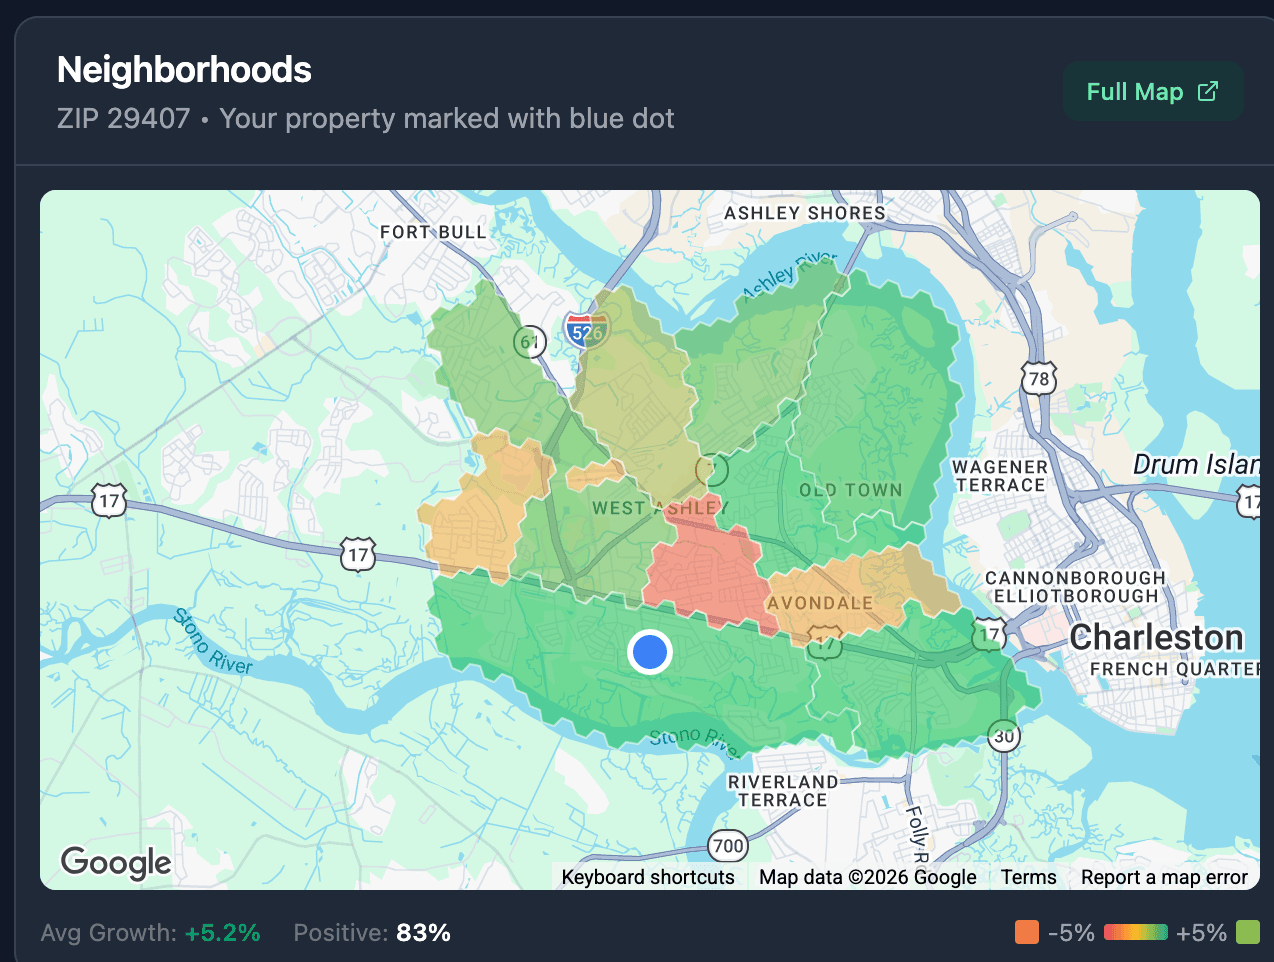
Neighborhood appreciation around the subject property — the local context behind the rank.
Local context, not just a ZIP average
The rank sits inside a measured local picture: which neighborhoods around this property have appreciated, which haven't, and how the subject compares to its immediate surroundings.
This measured local history distinguishes one block from another inside the same ZIP, where many property decisions actually differ.
From rank to cash flow, on the same row
The same engine that produces the rank also generates the per-property cash-flow read: annualized return, monthly cash, sale value, and a full month-by-month schedule. One signal, two surfaces.
Mortgage and credit partners asked us to put this next to the rank — so a buyer, advisor, or credit desk can move from “does this score?” to “does it cash flow?” without switching tools.
It scales the same way the rank does: render it per-row for a tape, or surface it for a single home in the hub.
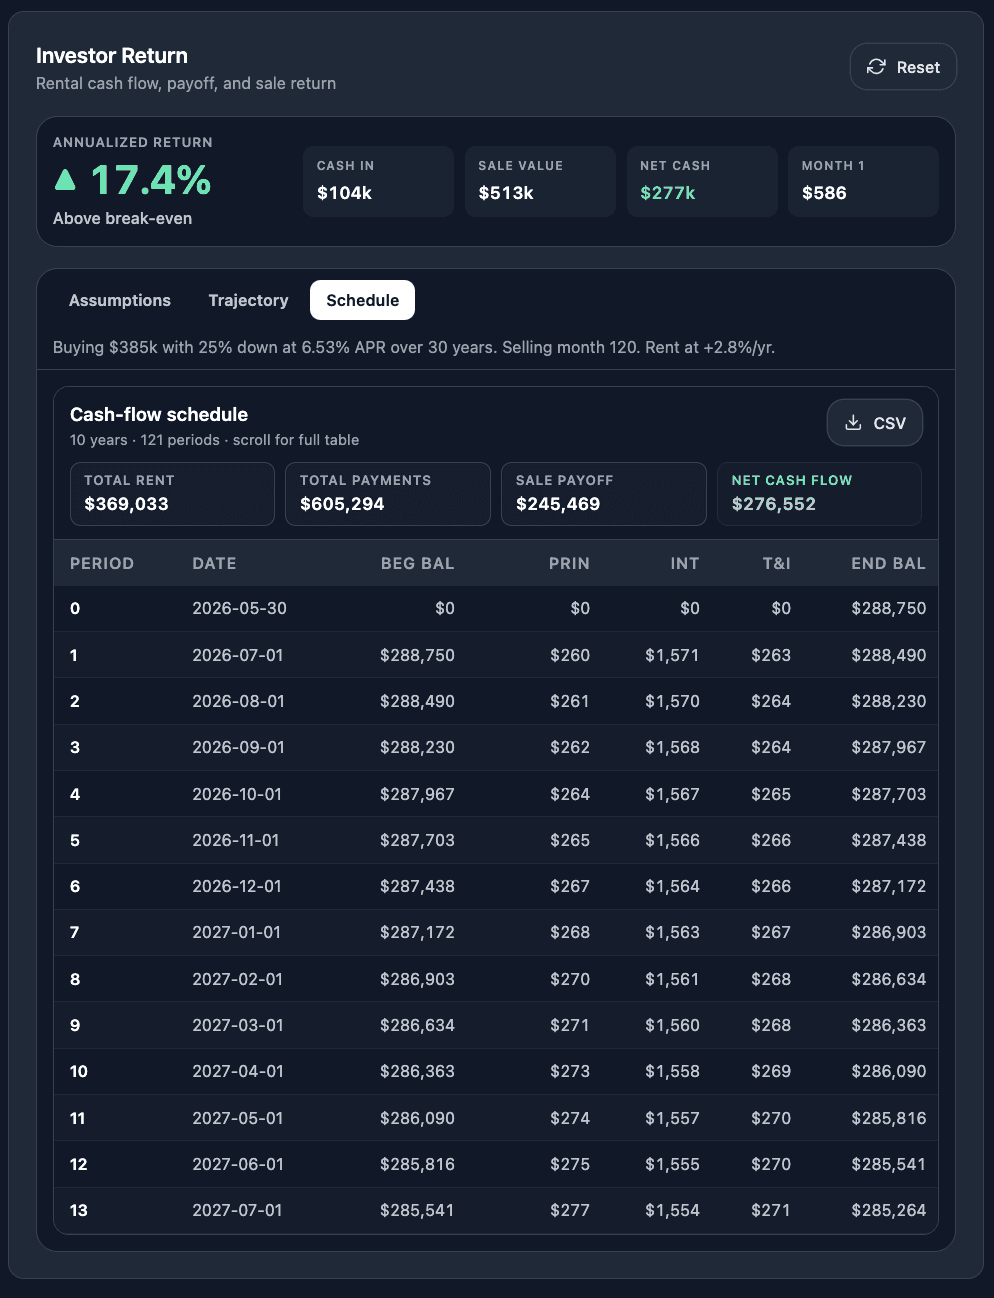
Per-property cash flow: annualized return, monthly cash, sale value, and a month-by-month schedule.
Where it fits in the decision
Good Investment sits before diligence, negotiation, underwriting, and committee review. It does not approve a deal, replace the professional, or guarantee a return. It gives the person making the decision a stronger starting point.
That is the platform promise: one consistent appreciation read, from a single property to a full review queue.
What Is a Property Appreciation Score? A Plain-English Guide to Within-Market Ranking
A plain-English guide to within-market scores, measured appreciation edge in points per year, estimated pace, validation, and confidence.
Is This House a Good Investment? How to Tell If a Home Will Appreciate
The honest answer to "is this house a good investment?" is rarely the asking price. Here is how to judge whether a home is positioned to appreciate within its own market.
Ready to see the read?
Start with a property and see its within-market score, measured market edge, and estimated appreciation pace.
Start freeFirst analysis free. No credit card required.